Langfuse Agent Tracing: Tools, Retries, and Failures
TL;DR
- -Use one root observation for the user-visible task, then attach retrieval, generations, and every tool attempt as children.
- -A retry is a new tool observation. Overwriting the failed attempt removes the evidence you need to explain latency and recovery.
- -Put a terminal failure on the tool child, and use the root level to record the task outcome without marking successful siblings as failed.
- -Redact before calling the Langfuse SDK and use a fixed allowlist before saving an export.
- -A real run with Python SDK 4.14.5 and self-hosted Langfuse 3.205.0 caught an ID-contract bug that fake adapter tests missed.
Our first remote Langfuse trace contained the root task and none of its children. The
workflow had completed correctly. Six adapter tests were green. The fault was one
attribute name: the installed Python SDK wrapper exposed the span ID as id, while the
contract we had copied from a class docstring used observation_id.
That failure is why this is not another diagram assembled from documentation. We ran a fixed support workflow against a self-hosted Langfuse instance, inspected the returned parentage, and repeated it for a successful run, a tool retry, and a terminal tool error. We also sent the same workflow to an unreachable exporter.
The pattern that survived those tests is straightforward:
Create one root observation for the user-visible task. Record retrieval, model work, and each tool attempt as a child. Keep tool failure on the tool observation, summarize the task outcome on the root, and redact before telemetry leaves the application.
This article stays on that implementation problem. For installation and credentials, use the current Langfuse setup tutorial. For metrics, alerts, and the larger operating model, start with production LLM observability.
What we tested
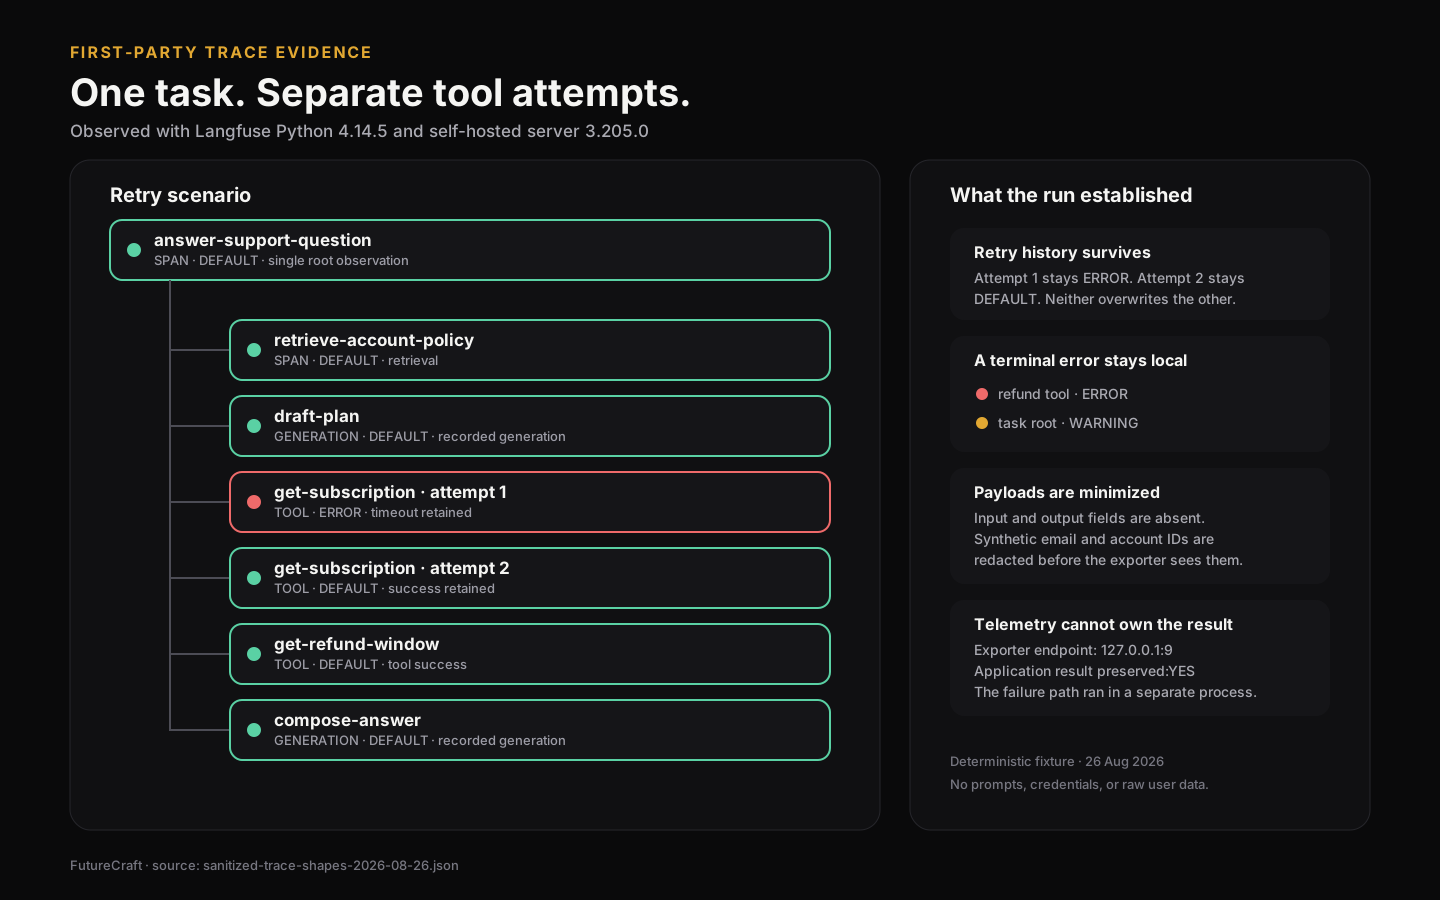
The fixture answers a synthetic refund question. It retrieves one policy, records a plan, calls two deterministic tools, and composes an answer:
answer-support-question
├── retrieve-account-policy
├── draft-plan
├── tool:get-subscription
├── tool:get-refund-window
└── compose-answer
The run used no live model or customer data. Model responses and tool results were fixed so that a rerun would test trace structure rather than provider drift.
| Component | Version in the run |
|---|---|
| Langfuse Python SDK | 4.14.5 |
| Self-hosted Langfuse | 3.205.0 |
| Python | 3.13.9 |
| Fixture release | 6401879 |
We ran three remote scenarios on 26 August 2026:
- both tools succeed;
- the subscription tool times out, then succeeds on its second attempt;
- the refund tool ends with a terminal error and the answer is sent for human review.
A fourth process pointed Langfuse at 127.0.0.1:9. The application still returned the
same fixture answer. That test did not prove that telemetry is never lost; it proved
the narrower claim that this workflow did not make telemetry availability part of its
result path.
Give the task one root observation
The root should represent the transaction a user would recognize: answer a support question, prepare an itinerary, or review a pull request. If the root represents only one model call, tool failures and recovery happen outside the task boundary.
Langfuse documents a trace as the observations that share one trace ID. It also maps
observations to OpenTelemetry spans and supports nested context propagation. The
SDK overview covers that model.
The current
Python instrumentation guide
documents explicit trace_context with trace_id and parent_span_id.
Automatic context is convenient inside one synchronous call stack. Our fixture uses
explicit parentage because the same adapter boundary can later receive events from a
queue or another service. The important part is the SDK wrapper’s actual trace_id
and id values:
parent = self.observations[event.parent_id]
trace_context = {
    "trace_id": parent.trace_id,
    "parent_span_id": parent.id,
}

observation = self.client.start_observation(
    name=event.name,
    as_type=event.kind,
    trace_context=trace_context,
    metadata=safe_metadata(event),
    version=self.fixture_version,
    model="recorded-fixture-v1" if event.kind == "generation" else None,
)
The first implementation read parent.observation_id. Our fake object exposed that
same invented field, so the contract tests confirmed each other instead of confirming
the installed SDK. In the remote run, child creation failed inside telemetry isolation
and only the root arrived.
The fix was small: use parent.id. The lesson is broader but not complicated. If an
adapter controls causal parentage, run at least one integration test against the exact
SDK version you ship. A fake should copy the runtime surface, not the documentation you
hope is accurate.
Record every retry as a separate tool attempt
Do not reopen or overwrite the failed tool observation. A retry is another network attempt, with its own start, end, error, and result.
Our timeout scenario produced this shape:
answer-support-question                 DEFAULT
├── tool:get-subscription  attempt=1    ERROR   TimeoutError
├── tool:get-subscription  attempt=2    DEFAULT
├── tool:get-refund-window attempt=1    DEFAULT
└── other successful children           DEFAULT
Both subscription attempts share the root parent but have different observation IDs. The first ends before the second begins. That gives an operator enough evidence to answer three practical questions: did a retry happen, which attempt failed, and did the task recover?
One observation with attempt=2 and a successful final status would hide the timeout.
One observation left in ERROR after recovery would make the task look worse than the
user experienced. Separate attempts preserve both facts.
In application code, generate a logical ID per attempt rather than per tool name:
for attempt in (1, 2):
    observation_id = f"subscription-{attempt}"
    # Application wrapper, not a Langfuse SDK method.
    trace.start_tool(
        observation_id=observation_id,
        name="tool:get-subscription",
        parent_id=root_id,
        attempt=attempt,
    )
    try:
        subscription = tools.get_subscription(account_id)
    except TimeoutError as error:
        trace.end_tool(
            observation_id=observation_id,
            level="ERROR",
            error_type=type(error).__name__,
        )
        if attempt == 2:
            raise
        continue

    trace.end_tool(observation_id=observation_id, level="DEFAULT")
    break
The downloadable fixture uses a small sink interface rather than the illustrative
start_tool wrapper above. This keeps the agent workflow independent of Langfuse and
makes exporter failure testable.
Keep child failure and task outcome separate
A failed tool call does not always mean the whole task failed. It may be retried, or the application may return a safe fallback that needs human review.
In the terminal scenario, tool:get-refund-window ended as ERROR. Retrieval, the
subscription lookup, and both generations remained DEFAULT. The root ended as
WARNING, because the workflow returned a bounded answer but could not confirm refund
eligibility.
tool:get-refund-window → ERROR: TerminalToolError
answer-support-question → WARNING: requires human review
successful siblings → DEFAULT
This is an engineering policy, not a Langfuse law. Define the mapping before adding dashboards:
| Observation | Level | Meaning in this fixture |
|---|---|---|
| Failed tool attempt | ERROR | That operation did not complete |
| Recovered root | DEFAULT | The task produced its intended result |
| Degraded root | WARNING | The task returned a safe but incomplete result |
| Successful sibling | DEFAULT | Its own operation completed |
Without that distinction, an alert on child errors can be mistaken for a count of failed user tasks. The broader production LLM stack control plane should track both operation-level failure and task-level outcome.
Redact before the SDK sees the event
The fixture starts with a synthetic email address and account ID. Its redaction function runs while trace attributes are created, before the adapter calls Langfuse. No observation input or output payload is exported at all.
EMAIL_PATTERN = re.compile(
    r"[A-Z0-9._%+-]+@[A-Z0-9.-]+\.[A-Z]{2,}",
    re.I,
)
ACCOUNT_PATTERN = re.compile(r"\bacct_[A-Z0-9]+\b", re.I)


def redact_text(value: str) -> str:
    value = EMAIL_PATTERN.sub("[EMAIL_REDACTED]", value)
    return ACCOUNT_PATTERN.sub("[ACCOUNT_REDACTED]", value)
These two expressions cover the synthetic fixture, not every form of personal data. Production redaction needs a data inventory and tests for the identifiers your product actually handles. Langfuse’s current masking documentation recommends masking before trace data leaves the application and documents SDK hooks for inputs, outputs, metadata, and OpenTelemetry attributes.
We added a second boundary for the published evidence. The authenticated trace response contained the Langfuse public key inside SDK scope metadata. A public key is not the secret key, but it still did not belong in a portable trace sample. The exporter now copies only a fixed set of fields and rejects either credential if it appears in the saved JSON.
Redaction and export minimization solve different problems:
- redaction changes sensitive values before telemetry is sent;
- an allowlist prevents unrelated server metadata from entering a public artifact;
- a final negative scan checks the exact file that will be published.
Keep telemetry outside the result path
The workflow accepts a TraceSink. A SafeTraceSink catches exporter-specific
exceptions and counts dropped events without changing the business result:
@dataclass
class SafeTraceSink:
    delegate: TraceSink
    dropped_events: int = 0

    def record(self, event: TraceEvent) -> None:
        try:
            self.delegate.record(event)
        except Exception:
            self.dropped_events += 1
Langfuse states that SDK errors are caught and logged, and that requests are exported
asynchronously. Its
Python instrumentation guide
also tells short-lived processes to call flush(). Our application-level guard does
not replace those SDK guarantees; it keeps the workflow contract independent of a
specific exporter.
There is a cost to this choice: traces can be incomplete while the user still receives an answer. Track dropped telemetry through a separate operational signal. Do not turn an observability outage into a product outage merely to make a dashboard complete.
Reproduce the evidence
The artifact bundle contains the deterministic workflow, Langfuse adapter, standard-library tests, integration runner, sanitized JSON, and the diagram shown above. Code is MIT-licensed; the evidence report and diagram use CC BY 4.0.
Run the dependency-free contract suite first:
# Run this from the directory containing the downloaded files.
python3 -m unittest discover -s . -p 'test_*.py' -v
For a real integration run, provide dedicated project credentials through environment variables and use an isolated SDK environment:
uv run --isolated --with langfuse==4.14.5 python \
  run_integration.py \
  --output /tmp/futurecraft-langfuse-evidence.json
Do not print credentials or save the raw authenticated response. The runner minimizes the response in memory, checks parentage and levels, scans for synthetic identifiers and keys, and writes only the sanitized shape.
What this run does not prove
- The recorded model and tools do not represent live provider behavior.
- Millisecond timestamps from one local run are not a latency benchmark.
- One SDK and server combination does not prove compatibility with every release.
- The fixture’s regexes are not a universal PII detector.
- A complete trace does not prove that the model answer is correct.
The useful result is narrower: with the tested versions, explicit parentage produced one inspectable task tree; retries remained separate; a terminal child error did not erase successful work; redaction happened before export; and an unavailable exporter did not change the fixture result.
That is enough to turn agent tracing from a decorative waterfall into an operational record you can challenge and rerun.